


Editor's Review
Create insightful reports & dashboards, Visually analyze your business information.Easily create insightful reports & dashboards using a drag and drop interface. No IT help required.
About Zoho Analytics
Zoho Analytics (Package Name: com.zoho.reports) is developed by Zoho Corporation and the latest version of Zoho Analytics – Mobile BI 4.4.0 was updated on November 20, 2024. Zoho Analytics – Mobile BI is in the category of Business with the feature Real time collaboration and Customizable, etc. You can check all apps from the developer of Zoho Analytics – Mobile BI and find 200 alternative apps to Zoho Analytics – Mobile BI on Android. Currently this app is for free. This app can be downloaded on Android 8.0+ on APKPure.fo or Google Play. All APK/XAPK files on APKPure.fo are original and 100% safe with fast download.
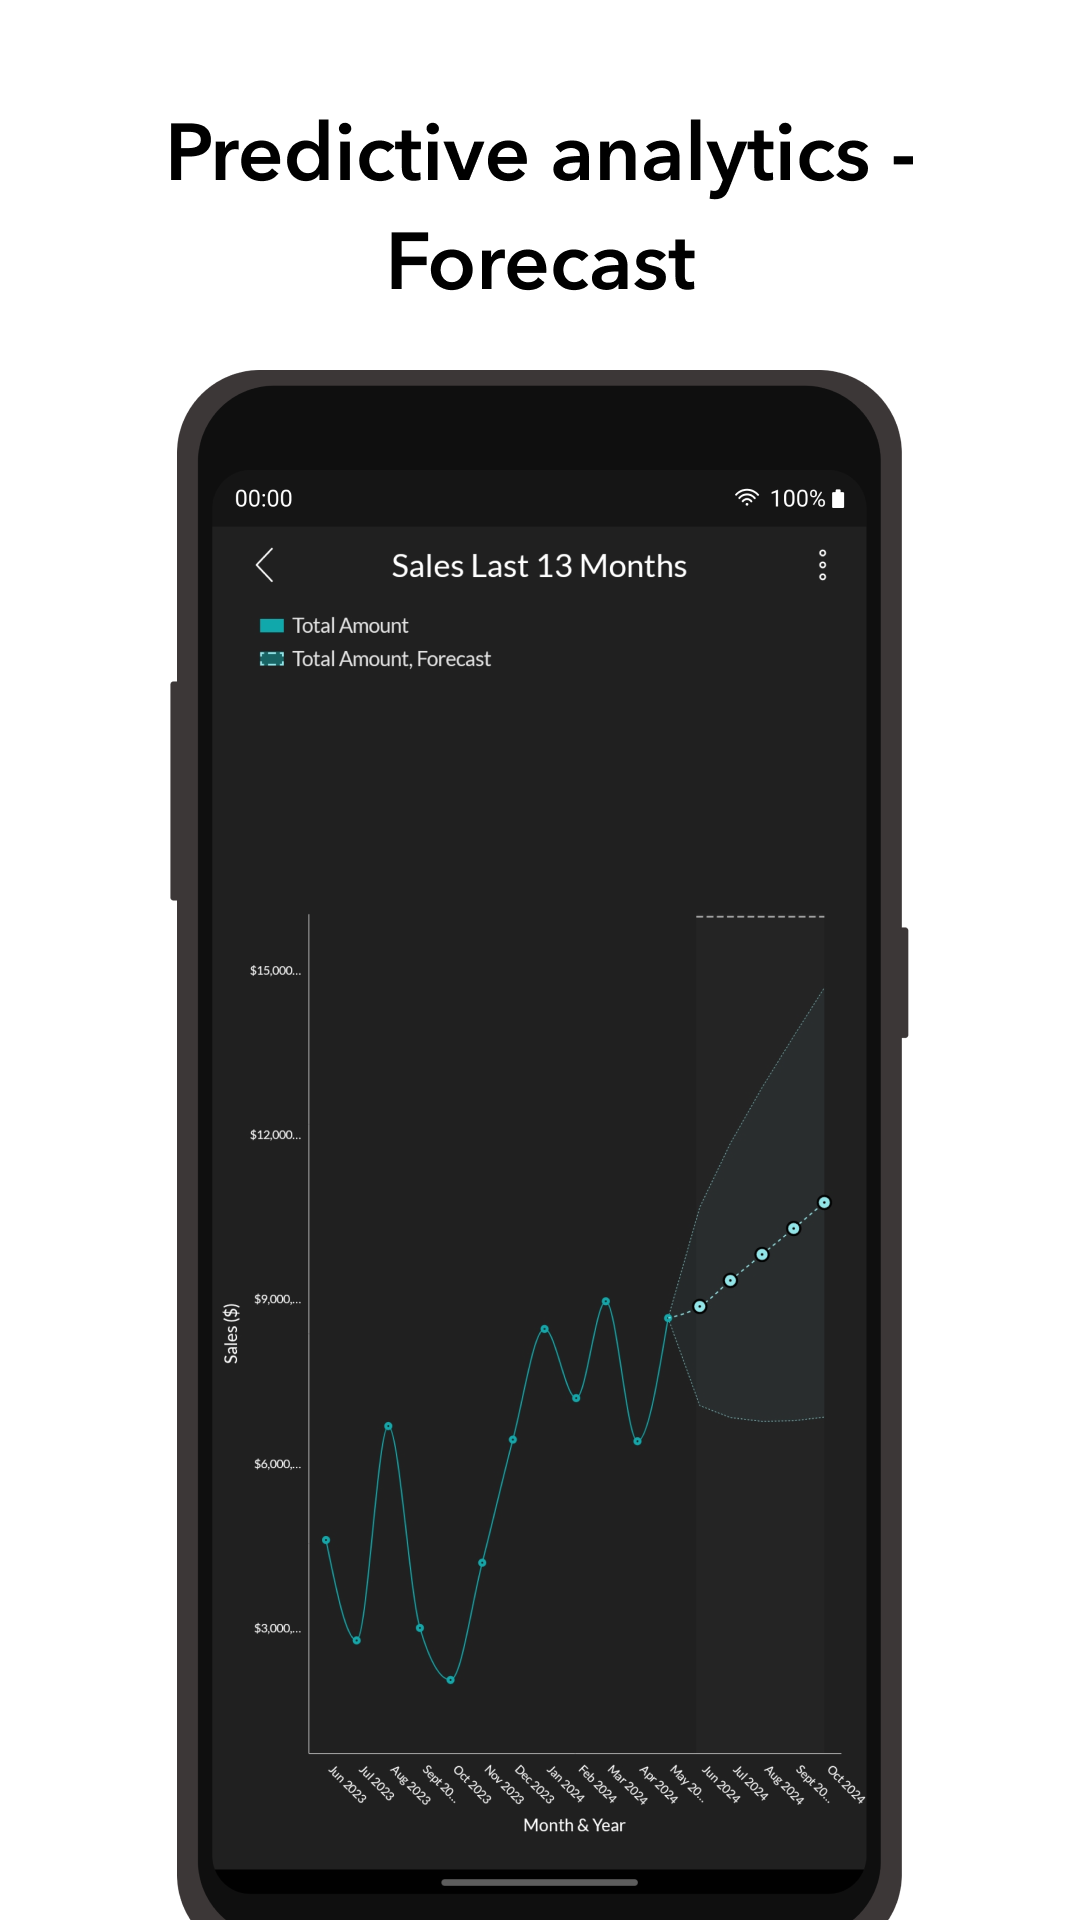
View insightful visualizations on-the-go, enabled by this data visualization software.
This mobile business intelligence (BI) app complements the full web browser view offered by Zoho Analytics, the self-service BI and analytics software on the cloud. The app enables you to keep track of your key business metrics, spot trends early, collaborate with your colleagues, and arrive at informed business decisions, all on the go, enabling mobile BI analytics.
With this app, you can see all the data, reports and dashboards that you created and have in your Zoho Analytics account. You can interact with the reports, favorite those that you like or view very often, share them with your colleagues, clients and friends with fine-grained access control, and do much more.
The app allows you to analyze data and perform business data analytics, from a wide range of sources easily. It scales well and can crunch hundreds of millions of rows of data, creating analytics dashboards.
The below features make the Zoho Analytics app an indispensable mobile BI analytics and reporting tool, for any business user.
Key Features
- Wide range of visualization options - geo-map, pie, donut, bar, stacked bar, line, bar-line combo, funnel, heat-map, web and a lot more chart types; Pivot tables, summary and tabular views.
- View single page, at-a-glance dashboards.
- Dashboards like KPI dashboards, business dashboards, marketing analytics dashboards, sales analytics dashboards and much more can be created with ease
- Apply filters and see filtered data.
- See the underlying data, or drill-down any point in the report.
- Segregate reports based on type, folders and related views.
- Quickly access select reports using Favorites and Recent Items.
- Export and share your reports with your colleagues and clients, with fine-grained access control. You control what the shared user can or can't do, like create reports, view/drill-down the underlying data, export the data/reports, etc
Zoho Analytics 4.4.0 Update
Butterfly charts are now supported, enabling side-by-side comparison of two opposing data sets for easier analysis
Data labels in reports have been improved for a clearer display, with no overlap and better alignment using skip logic
Global user filter is now supported
New UI enhancements in Tabbed Dashboard
Web Theme Palette is now supported and retained
Bug fixes
Data labels in reports have been improved for a clearer display, with no overlap and better alignment using skip logic
Global user filter is now supported
New UI enhancements in Tabbed Dashboard
Web Theme Palette is now supported and retained
Bug fixes
Read More
Previous Versions More
Zoho Analytics – Mobile BI
4.4.0
XAPK
APKs
November 16, 2024
83.96 MB
Variant
Arch
Version
DPI
Zoho Analytics – Mobile BI
4.3.0
XAPK
APKs
September 12, 2024
83.38 MB
Variant
Arch
Version
DPI
Zoho Analytics – Mobile BI
4.2.0
XAPK
APKs
August 26, 2024
60.7 MB
Requires Android: Android 8.0+
Architecture: arm64-v8a
Screen DPI: 120-640dpi
SHA1: b4cc66163a71581e269f11e815ca0c9af1d2659d
Size: 60.7 MB
What's New:
- Text, Image and Embed widget supported in mobile app
- On-Premise related issue fix
- On-Premise related issue fix
Zoho Analytics – Mobile BI
4.1.0
XAPK
APKs
July 31, 2024
58.56 MB
Requires Android: Android 8.0+
Architecture: arm64-v8a
Screen DPI: 120-640dpi
SHA1: b7b9b8e96f4a39732ce7af39fb71394282a6ddef
Size: 58.56 MB
What's New:
- Custom Formatted Color for Charts
- Data Label Configuration
- KPI Widget Colors
- Conditional formatting applied to tables can now be retained.
- Web View Access
- Move to Top/Bottom option in native tables
- Full View and VUD Support for KPI Widgets
- Various bug fixes to improve performance and stability, ensuring a smoother user experience.
More Information
Package Name:
Update Date:
2024-11-20
Latest Version:
4.4.0
Need Update:
Available on:
Requirements:
Android 8.0+
Report:
Alternatives to Zoho Analytics
Gradepen
Create tests and templates and correct them automatically anywhere!
23
ODK Collect
Collect data anywhere
8.0 901
Freshdesk
Streamline your support and make customers happy
8.7 604
Zoho WorkDrive
File sync, storage, and collaboration platform for modern teams.
6.7 28
Quiz Maker Professional
Professional version of QuizMaker to play create and share quizzes!
7.4 42
Developer Apps
Notebook - Note-taking & To-do
Easy to use notes app, To-do lists, reminders, notepad, memo
8.9 4K+
Zoho Mail - Email and Calendar
Zoho Mail - Email, Calendar, Contacts and Files on the move!
9.2 2K+
Zoho Writer - Document Editor
Create, edit and collaborate on documents on the move.
6.4 286
Zoho Creator: Lowcode Platform
Take work wherever you go
7.9 164
Zoho Sheet - Spreadsheet App
Create, edit, share, and collaborate on your spreadsheets online.
7.4 199